Market Update Preview
Friday brought the sell-off we'd been flagging as a possibility — a hot jobs print spiked the VIX, dropped the Nasdaq nearly 5%, and sent yields jumping. The takeaway: the last argument for rate cuts (a soft labor market) just got dashed, and the market had to reprice valuations that were quietly still hoping for cuts.
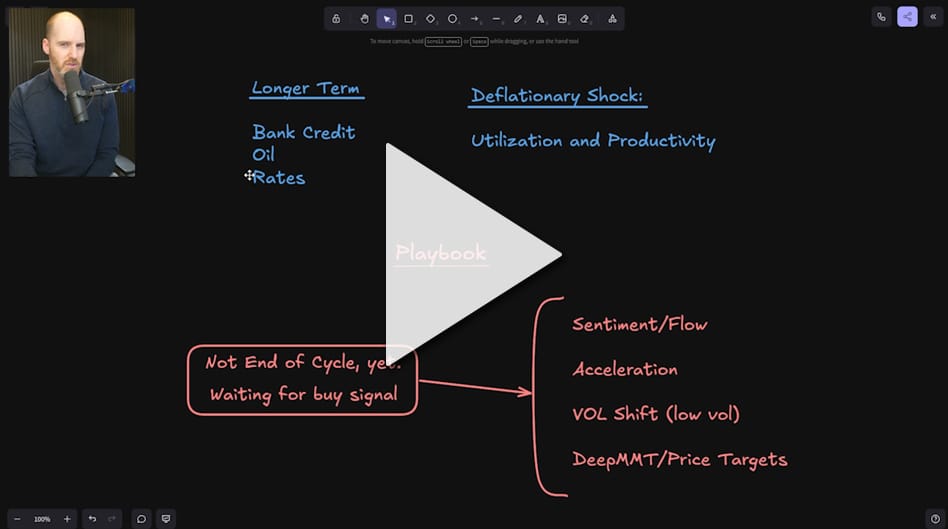
We hit the 7300 zone I mentioned in the last update almost exactly. The question now is whether we hold it, bounce, or roll straight into the deeper sell-off I've been expecting around the mid-June-into-July window. I'll lay out exactly how I'm playing this, the level where I start moving defensive, and why I'm done chasing this move even if there's one more high left in it.
The longer-term picture hasn't changed: the deficit impulse keeps deteriorating in real terms with a 4.2% CPI consensus landing Wednesday, margin debt keeps accelerating toward danger levels, and credit is recovering from the oil shock exactly as we modeled. But — and this matters — I still don't think this is the end of the cycle. Full breakdown, including the levels and the playbook, below.