Will Aarons and Asani Sarkar
Federal Reserve Bank of New York Feed Items
AI’s Macroeconomic Challenges and Promises
—
In the third quarter of 2025, America’s largest tech firms for the first time spent more on capital investment than they earned from operations. The implication is that AI, a technology with the potential to make the economy more productive, is, for now, absorbing resources faster than it is generating returns. This post discusses how the tension between AI’s long-run promise and its short-run costs affects the outlooks for inflation, real activity, and financial stability.
Will Mounting Supply Chain Strains Hamstring the AI Investment Boom?
—Editor’s Note: The original version of the post included an inaccurate statement about the last chart. The chart itself is correct. The text has been removed. May 14, 3:22pm.
In What Ways Has U.S. Trade with China Changed?
—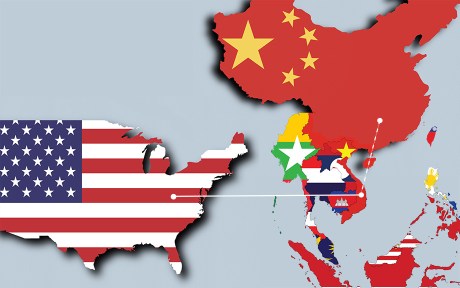
Over the past year, U.S. trade policy with China has undergone enormous changes, but with surprisingly little effect on overall trade balances. In fact, the U.S.’s twelve-month trade deficit, while highly volatile due to import front-running early in the year, ended 2025 at $1.2 trillion, almost unchanged from 2024. At the same time, China’s trade surplus with the world actually increased from $1 trillion to $1.2 trillion. However, when looking at changes between individual countries, one sees large shifts in bilateral balances. In this post, we will focus on changing trade flows between the U.S., China, and southeast Asia.
Tracking the K‑Shaped Economy: Who’s Driving Spending?
—Editors’ Note: The title of the second chart in this post has been corrected. May 1, 10:40 am.
Bank Failures: The Roles of Solvency and Liquidity
—
Do banks fail because of runs or because they become insolvent? Answering this question is central to understanding financial crises and designing effective financial stability policies. Long-run historical evidence reveals that the root cause of bank failures is usually insolvency. The importance of bank runs is somewhat overstated. Runs matter, but in most cases they trigger or accelerate failure at already weak banks, rather than cause otherwise sound banks to fail.
Treasury Market Liquidity Since April 2025
—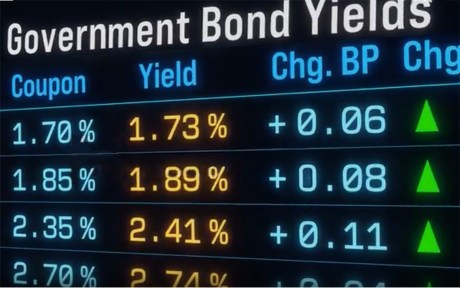
In this post, we examine the evolution of U.S. Treasury market liquidity over the past year, which has witnessed myriad economic and political developments. Liquidity worsened markedly one year ago as volatility increased following the announcement of higher-than-expected tariffs. Liquidity quickly improved when the tariff increases were partially rolled back and then remained fairly stable thereafter (through the end of our sample in February 2026), including after the recent Supreme Court decision striking down the emergency tariffs and the subsequent announcement of new tariffs.
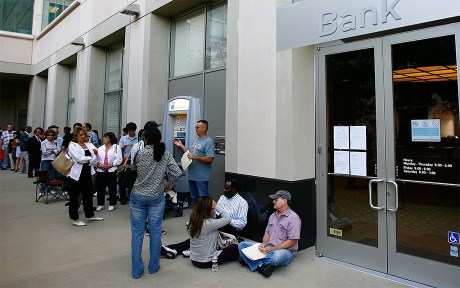
Behind the ATM: Exploring the Structure of Bank Holding Companies
—Editor’s note: The fifth and sixteenth paragraphs have been revised for technical accuracy. April 8, 2026, 5:00 p.m.
Sports Betting Is Everywhere, Especially on Credit Reports
—Editor’s Note: The chart notes for the first chart have been updated to correct errors in how we labeled the trend line colors. (March 25, 2026)
What Workplace Composition Are Job Candidates Looking For?
—
Why do workers still segregate by sex across occupations, industries, and firms? Recent research has focused on how preferences for job amenities, like flexibility, may differ by sex. However, one “amenity” that has received relatively little attention is the sex composition of a job itself. In a recent paper, I conducted a survey experiment to estimate men’s and women’s preferences for sex composition in the workplace. One result is that women and young single men prefer jobs with at least half female coworkers.
Who Is Paying for the 2025 U.S. Tariffs?
—
Over the course of 2025, the average tariff rate on U.S. imports increased from 2.6 to 13 percent. In this blog post, we ask how much of the tariffs were paid by the U.S., using import data through November 2025. We find that nearly 90 percent of the tariffs’ economic burden fell on U.S. firms and consumers.
A New Dataset for Consumer Spending in the New York Fed EHIs
—
We are enhancing our set of Economic Heterogeneity Indicators (EHIs) by adding a set of metrics on consumer spending with data presented by income, education, race and ethnicity, age, and urban status. The data will help track the evolution of aggregate behavior by analyzing the spending of specific groups in a more timely manner than is possible using public surveys.
Tariffs, Trade, and Tumbling Credit Scores: The Top 5 LSE Posts of 2025
—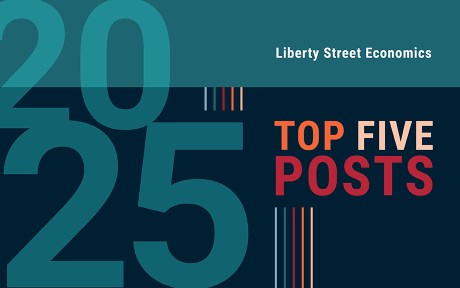
Each year brings a new set of economic challenges: In 2025, major areas of focus included tariffs and trade tensions, as well as the financial pressures facing younger adults. New York Fed economists contributed insightful research on both topics—and readers took notice. In fact, all five of the year’s most-read posts on Liberty Street Economics analyzed aspects of these issues. Read on to see how the restoration of student loan data to credit reports affected borrowers’ credit scores, whether the costs of a college degree are still worth it, how businesses are responding to higher tariffs, and why the U.S. runs a trade deficit.
A New Public Data Source: Call Reports from 1959 to 2025
—
Call Reports are regulatory filings in which commercial banks report their assets, liabilities, income, and other information. They are one of the most-used data sources in banking and finance. In this post, we describe a new dataset made available on the Federal Reserve Bank of New York’s website that contains time-consistent balance sheets and income statements for commercial banks in the United States from 1959 to 2025.