The PBS is, literally, a life saver for Australian families.
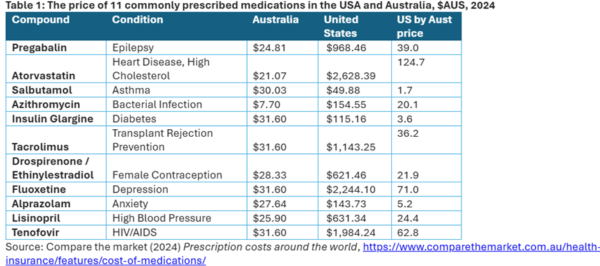
The Australia Institute has compared the staggering difference between the prices Australians and Americans pay for some of the most common medicines in the world.
For example, Atorvastatin – a cholesterol pill which is among the top ten most prescribed drugs in Australia – is 125 times more expensive in the US. Australians pay $21.07 for a prescription of Atorvastatin. Americans are slugged $2,628.39 for the same medication.
A commonly used tablet for high blood pressure, Lisinopril, is almost 25 times more expensive in the US than in Australia.
More than 10 million Salbutamol asthma puffers are prescribed or sold over the counter in Australia each year. For every $30 Australians spend on these puffers, Americans are charged $50.


